Next: Package engineering-format, Previous: Package drawdf [Contents][Index]
56 Package dynamics
Next: Graphical analysis of discrete dynamical systems, Previous: Package dynamics, Up: Package dynamics [Contents][Index]
56.1 The dynamics package
Package dynamics includes functions for 3D visualization,
animations, graphical analysis of differential and difference equations
and numerical solution of differential equations. The functions for
differential equations are described in the section on Numerical Methods and the functions to plot the Mandelbrot and Julia
sets are described in the section on Plotting.
All the functions in this package will be loaded automatically the first time they are used.
Next: Visualization with VTK, Previous: The dynamics package, Up: Package dynamics [Contents][Index]
56.2 Graphical analysis of discrete dynamical systems
- Function: chaosgame ([[x1, y1]…[xm, ym]], [x0, y0], b, n, options, …); 
-
Implements the so-called chaos game: the initial point (x0, y0) is plotted and then one of the m points [x1, y1]…xm, ym] will be selected at random. The next point plotted will be on the segment from the previous point plotted to the point chosen randomly, at a distance from the random point which will be b times that segment’s length. The procedure is repeated n times. The options are the same as for
plot2d.Example. A plot of Sierpinsky’s triangle:
(%i1) chaosgame([[0, 0], [1, 0], [0.5, sqrt(3)/2]], [0.1, 0.1], 1/2, 30000, [style, dots]);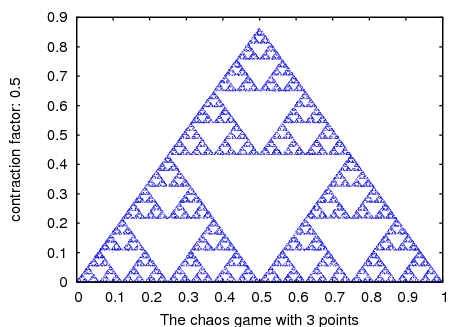 Categories: Package dynamics · Plotting ·
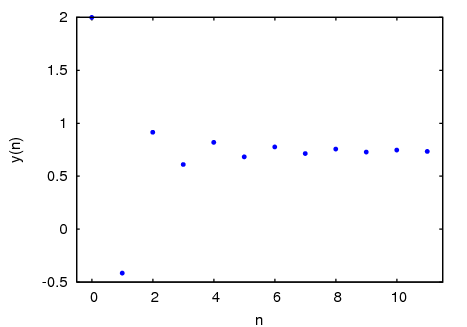
- Function: evolution (F, y0, n, …, options, …); 
-
Draws n+1 points in a two-dimensional graph, where the horizontal coordinates of the points are the integers 0, 1, 2, ..., n, and the vertical coordinates are the corresponding values y(n) of the sequence defined by the recurrence relation
y(n+1) = F(y(n))
With initial value y(0) equal to y0. F must be an expression that depends only on one variable (in the example, it depend on y, but any other variable can be used), y0 must be a real number and n must be a positive integer. This function accepts the same options as
plot2d.Example.
(%i1) evolution(cos(y), 2, 11);
 Categories: Package dynamics · Plotting ·
- Function: evolution2d ([F, G], [u, v], [u0, y0], n, options, …); 
-
Shows, in a two-dimensional plot, the first n+1 points in the sequence of points defined by the two-dimensional discrete dynamical system with recurrence relations
u(n+1) = F(u(n), v(n)) v(n+1) = G(u(n), v(n))
With initial values u0 and v0. F and G must be two expressions that depend only on two variables, u and v, which must be named explicitly in a list. The options are the same as for
plot2d.Example. Evolution of a two-dimensional discrete dynamical system:
(%i1) f: 0.6*x*(1+2*x)+0.8*y*(x-1)-y^2-0.9$
(%i2) g: 0.1*x*(1-6*x+4*y)+0.1*y*(1+9*y)-0.4$
(%i3) evolution2d([f,g], [x,y], [-0.5,0], 50000, [style,dots]);
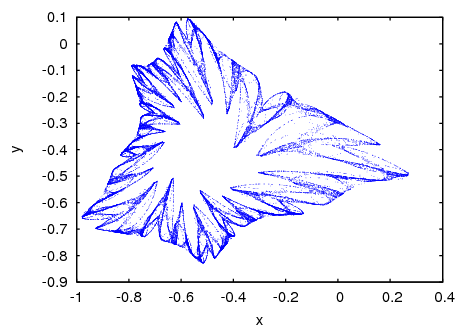
And an enlargement of a small region in that fractal:
(%i9) evolution2d([f,g], [x,y], [-0.5,0], 300000, [x,-0.8,-0.6], [y,-0.4,-0.2], [style, dots]);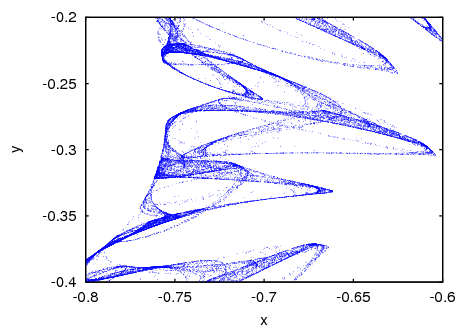 Categories: Package dynamics · Plotting ·
- Function: ifs ([r1, …, rm], [A1,…, Am], [[x1, y1], …, [xm, ym]], [x0, y0], n, options, …); 
-
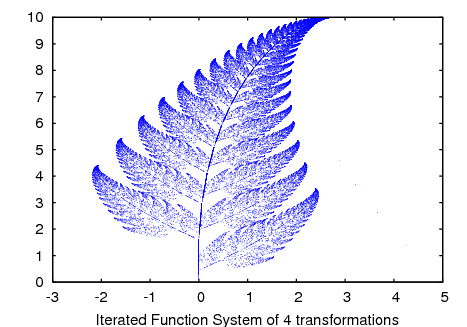
Implements the Iterated Function System method. This method is similar to the method described in the function
chaosgame. but instead of shrinking the segment from the current point to the randomly chosen point, the 2 components of that segment will be multiplied by the 2 by 2 matrix Ai that corresponds to the point chosen randomly.The random choice of one of the m attractive points can be made with a non-uniform probability distribution defined by the weights r1,...,rm. Those weights are given in cumulative form; for instance if there are 3 points with probabilities 0.2, 0.5 and 0.3, the weights r1, r2 and r3 could be 2, 7 and 10. The options are the same as for
plot2d.Example. Barnsley’s fern, obtained with 4 matrices and 4 points:
(%i1) a1: matrix([0.85,0.04],[-0.04,0.85])$
(%i2) a2: matrix([0.2,-0.26],[0.23,0.22])$
(%i3) a3: matrix([-0.15,0.28],[0.26,0.24])$
(%i4) a4: matrix([0,0],[0,0.16])$
(%i5) p1: [0,1.6]$
(%i6) p2: [0,1.6]$
(%i7) p3: [0,0.44]$
(%i8) p4: [0,0]$
(%i9) w: [85,92,99,100]$
(%i10) ifs(w, [a1,a2,a3,a4], [p1,p2,p3,p4], [5,0], 50000, [style,dots]);
 Categories: Package dynamics · Plotting ·
- Function: orbits (F, y0, n1, n2, [x, x0, xf, xstep], options, …); 
-
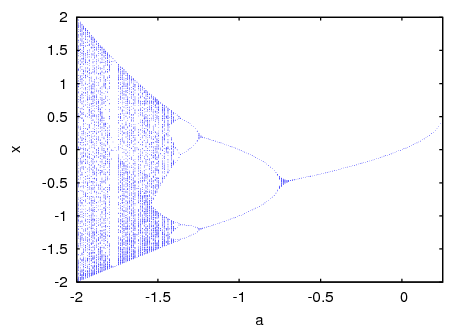
Draws the orbits diagram for a family of one-dimensional discrete dynamical systems, with one parameter x; that kind of diagram is used to study the bifurcations of an one-dimensional discrete system.
The function F(y) defines a sequence with a starting value of y0, as in the case of the function
evolution, but in this case that function will also depend on a parameter x that will take values in the interval from x0 to xf with increments of xstep. Each value used for the parameter x is shown on the horizontal axis. The vertical axis will show the n2 values of the sequence y(n1+1),..., y(n1+n2+1) obtained after letting the sequence evolve n1 iterations. In addition to the options accepted byplot2d, it accepts an option pixels that sets up the maximum number of different points that will be represented in the vertical direction.Example. Orbits diagram of the quadratic map, with a parameter a:
(%i1) orbits(x^2+a, 0, 50, 200, [a, -2, 0.25], [style, dots]);
To enlarge the region around the lower bifurcation near x
=-1.25 use:(%i2) orbits(x^2+a, 0, 100, 400, [a,-1,-1.53], [x,-1.6,-0.8], [nticks, 400], [style,dots]);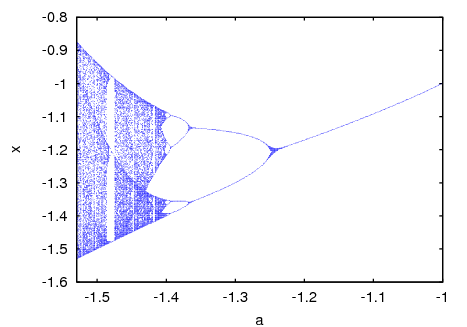 Categories: Package dynamics · Plotting ·
- Function: staircase (F, y0, n,options,…); 
-
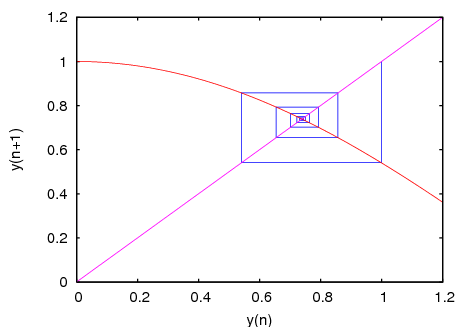
Draws a staircase diagram for the sequence defined by the recurrence relation
y(n+1) = F(y(n))
The interpretation and allowed values of the input parameters is the same as for the function
evolution. A staircase diagram consists of a plot of the function F(y), together with the line G(y)=y. A vertical segment is drawn from the point (y0, y0) on that line until the point where it intersects the function F. From that point a horizontal segment is drawn until it reaches the point (y1, y1) on the line, and the procedure is repeated n times until the point (yn, yn) is reached. The options are the same as forplot2d.Example.
(%i1) staircase(cos(y), 1, 11, [y, 0, 1.2]);
 Categories: Package dynamics · Plotting ·
Previous: Graphical analysis of discrete dynamical systems, Up: Package dynamics [Contents][Index]
56.3 Visualization with VTK
Function scene creates 3D images and animations using the Visualization ToolKit (VTK) software. In order to use that function, Xmaxima and VTK should be installed in your system (including the TCL bindings of VTK, which in some system might come in a separate package).
- Function: scene (objects, …, options, …); 
-
Accepts an empty list or a list of several
objectsandoptions. The program launches Xmaxima, which opens an external window representing the given objects in a 3-dimensional space and applying the options given. Each object must belong to one of the following 4 classes: sphere, cube, cylinder or cone (seeScene objects). Objects are identified by giving their name or by a list in which the first element is the class name and the following elements are options for that object.Example. A hexagonal pyramid with a blue background:
(%i1) scene(cone, [background,"#9980e5"])$

By holding down the left button of the mouse while it is moved on the graphics window, the camera can be rotated showing different views of the pyramid. The two plot options
elevationandazimuthcan also be used to change the initial orientation of the viewing camera. The camera can be moved by holding the middle mouse button while moving it and holding the right-side mouse button while moving it up or down will zoom in or out.Each object option should be a list starting with the option name, followed by its value. The list of allowed options can be found in the
Scene object's optionssection.Example. This will show a sphere falling to the ground and bouncing off without losing any energy. To start or pause the animation, press the play/pause button.
(%i1) p: makelist ([0,0,2.1- 9.8*t^2/2], t, 0, 0.64, 0.01)$

(%i2) p: append (p, reverse(p))$

(%i3) ball: [sphere, [radius,0.1], [thetaresolution,20],
  [phiresolution,20], [position,0,0,2.1], [color,red],
  [animate,position,p]]$

(%i4) ground: [cube, [xlength,2], [ylength,2], [zlength,0.2],
  [position,0,0,-0.1],[color,violet]]$

(%i5) scene (ball, ground, restart)$
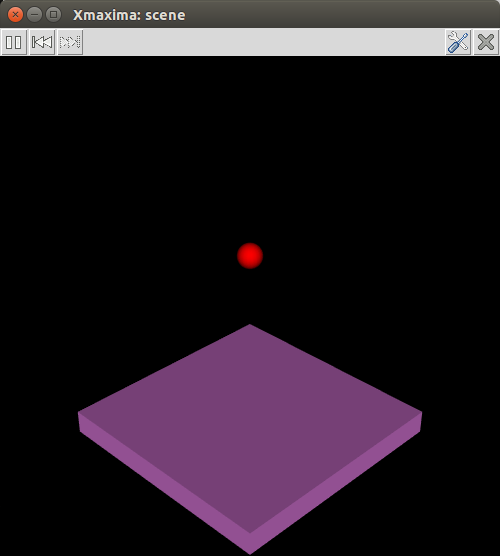
The restart option was used to make the animation restart automatically every time the last point in the position list is reached. The accepted values for the colors are the same as for the
coloroption of plot2d.Categories: Package dynamics · Plotting ·
56.3.1 Scene options
- Scene option: azimuth [azimuth, angle] 
Default value:
135The rotation of the camera on the horizontal (x, y) plane. angle must be a real number; an angle of 0 means that the camera points in the direction of the y axis and the x axis will appear on the right.
Categories: Package dynamics · Plotting ·
- Scene option: background [background, color] 
Default value:
blackThe color of the graphics window’s background. It accepts color names or hexadecimal red-green-blue strings (see the
coloroption of plot2d).Categories: Package dynamics · Plotting ·
- Scene option: elevation [elevation, angle] 
Default value:
30The vertical rotation of the camera. The angle must be a real number; an angle of 0 means that the camera points on the horizontal, and the default angle of 30 means that the camera is pointing 30 degrees down from the horizontal.
Categories: Package dynamics · Plotting ·
- Scene option: height [height, pixels] 
Default value:
500The height, in pixels, of the graphics window. pixels must be a positive integer number.
Categories: Package dynamics · Plotting ·
- Scene option: restart [restart, value] 
Default value:
falseA true value means that animations will restart automatically when the end of the list is reached. Writing just “restart” is equivalent to [restart, true].
Categories: Package dynamics · Plotting ·
- Scene option: tstep [tstep, time] 
Default value:
10The amount of time, in mili-seconds, between iterations among consecutive animation frames. time must be a real number.
Categories: Package dynamics · Plotting ·
- Scene option: width [width, pixels] 
Default value:
500The width, in pixels, of the graphics window. pixels must be a positive integer number.
Categories: Package dynamics · Plotting ·
- Scene option: windowname [windowtitle, name] 
Default value:
.scenename must be a string that can be used as the name of the Tk window created by Xmaxima for the
scenegraphics. The default value.sceneimplies that a new top level window will be created.Categories: Package dynamics · Plotting ·
- Scene option: windowtitle [windowtitle, name] 
Default value:
Xmaxima: scenename must be a string that will be written in the title of the window created by
scene.Categories: Package dynamics · Plotting ·
56.3.2 Scene objects
- Scene object: cone [cone, options] 
-
Creates a regular pyramid with height equal to 1 and a hexagonal base with vertices 0.5 units away from the axis. Options
heightandradiuscan be used to change those defaults and optionresolutioncan be used to change the number of edges of the base; higher values will make it look like a cone. By default, the axis will be along the x axis, the middle point of the axis will be at the origin and the vertex on the positive side of the x axis; use optionsorientationandcenterto change those defaults.Example. This shows a pyramid that starts rotating around the z axis when the play button is pressed.
(%i1) scene([cone, [orientation,0,30,0], [tstep,100],
   [animate,orientation,makelist([0,30,i],i,5,360,5)]], restart)$
Categories: Package dynamics · Plotting ·
- Scene object: cube [cube, options] 
-
A cube with edges of 1 unit and faces parallel to the xy, xz and yz planes. The lengths of the three edges can be changed with options
xlength,ylengthandzlength, turning it into a rectangular box and the faces can be rotated with optionorientation.Categories: Package dynamics · Plotting ·
- Scene object: cylinder [cylinder, options] 
-
Creates a regular prism with height equal to 1 and a hexagonal base with vertices 0.5 units away from the axis. Options
heightandradiuscan be used to change those defaults and optionresolutioncan be used to change the number of edges of the base; higher values will make it look like a cylinder. The default height can be changed with the optionheight. By default, the axis will be along the x axis and the middle point of the axis will be at the origin; use optionsorientationandcenterto change those defaults.Categories: Package dynamics · Plotting ·
- Scene object: sphere [sphere, options] 
-
A sphere with default radius of 0.5 units and center at the origin.
Categories: Package dynamics · Plotting ·
56.3.3 Scene object’s options
- Object option: animation [animation, property, positions] 
-
property should be one of the following 4 object’s properties:
origin,scale,positionororientationand positions should be a list of points. When the play button is pressed, the object property will be changed sequentially through all the values in the list, at intervals of time given by the optiontstep. The rewind button can be used to point at the start of the sequence making the animation restart after the play button is pressed again.See also
track.Categories: Package dynamics · Plotting ·
- Object option: capping [capping, number] 
Default value:
1In a cone or a cylinder, it defines whether the base (or bases) will be shown. A value of 1 for number makes the base visible and a value of 0 makes it invisible.
Categories: Package dynamics · Plotting ·
- Object option: center [center, point] 
Default value:
[0, 0, 0]The coordinates of the object’s geometric center, with respect to its
position. point can be a list with 3 real numbers, or 3 real numbers separated by commas. In a cylinder, cone or cube it will be at half its height and in a sphere at its center.Categories: Package dynamics · Plotting ·
- Object option: color [color, colorname] 
Default value:
whiteThe color of the object. It accepts color names or hexadecimal red-green-blue strings (see the
coloroption of plot2d).Categories: Package dynamics · Plotting ·
- Object option: endphi [endphi, angle] 
Default value:
180In a sphere phi is the angle on the vertical plane that passes through the z axis, measured from the positive part of the z axis. angle must be a number between 0 and 180 that sets the final value of phi at which the surface will end. A value smaller than 180 will eliminate a part of the sphere’s surface.
See also
startphiandphiresolution.Categories: Package dynamics · Plotting ·
- Object option: endtheta [endtheta, angle] 
Default value:
360In a sphere theta is the angle on the horizontal plane (longitude), measured from the positive part of the x axis. angle must be a number between 0 and 360 that sets the final value of theta at which the surface will end. A value smaller than 360 will eliminate a part of the sphere’s surface.
See also
startthetaandthetaresolution.Categories: Package dynamics · Plotting ·
- Object option: height [height, value] 
Default value:
1value must be a positive number which sets the height of a cone or a cylinder.
Categories: Package dynamics · Plotting ·
- Object option: linewidth [linewidth, value] 
Default value:
1The width of the lines, when option
wireframeis used. value must be a positive number.Categories: Package dynamics · Plotting ·
- Object option: opacity [opacity, value] 
Default value:
1value must be a number between 0 and 1. The lower the number, the more transparent the object will become. The default value of 1 means a completely opaque object.
Categories: Package dynamics · Plotting ·
- Object option: orientation [orientation, angles] 
Default value:
[0, 0, 0]Three angles by which the object will be rotated with respect to the three axis. angles can be a list with 3 real numbers, or 3 real numbers separated by commas. Example:
[0, 0, 90]rotates the x axis of the object to the y axis of the reference frame.Categories: Package dynamics · Plotting ·
- Object option: origin [origin, point] 
Default value:
[0, 0, 0]The coordinates of the object’s origin, with respect to which its other dimensions are defined. point can be a list with 3 real numbers, or 3 real numbers separated by commas.
Categories: Package dynamics · Plotting ·
- Object option: phiresolution [phiresolution, num] 
Default value:
The number of sub-intervals into which the phi angle interval from
startphitoendphiwill be divided. num must be a positive integer.Categories: Package dynamics · Plotting ·
- Object option: points [points] 
-
Only the vertices of the triangulation used to render the surface will be shown. Example:
[sphere, [points]]See also
surfaceandwireframe.Categories: Package dynamics · Plotting ·
- Object option: pointsize [pointsize, value] 
Default value:
1The size of the points, when option
pointsis used. value must be a positive number.Categories: Package dynamics · Plotting ·
- Object option: position [position, point] 
Default value:
[0, 0, 0]The coordinates of the object’s position. point can be a list with 3 real numbers, or 3 real numbers separated by commas.
Categories: Package dynamics · Plotting ·
- Object option: radius [radius, value] 
Default value:
0.5The radius or a sphere or the distance from the axis to the base’s vertices in a cylinder or a cone. value must be a positive number.
Categories: Package dynamics · Plotting ·
- Object option: resolution [resolution, number] 
Default value:
6number must be an integer greater than 2 that sets the number of edges in the base of a cone or a cylinder.
Categories: Package dynamics · Plotting ·
- Object option: scale [scale, factors] 
Default value:
[1, 1, 1]Three numbers by which the object will be scaled with respect to the three axis. factors can be a list with 3 real numbers, or 3 real numbers separated by commas. Example:
[2, 0.5, 1]enlarges the object to twice its size in the x direction, reduces the dimensions in the y direction to half and leaves the z dimensions unchanged.Categories: Package dynamics · Plotting ·
- Object option: startphi [startphi, angle] 
Default value:
0In a sphere phi is the angle on the vertical plane that passes through the z axis, measured from the positive part of the z axis. angle must be a number between 0 and 180 that sets the initial value of phi at which the surface will start. A value bigger than 0 will eliminate a part of the sphere’s surface.
See also
endphiandphiresolution.Categories: Package dynamics · Plotting ·
- Object option: starttheta [starttheta, angle] 
Default value:
0In a sphere theta is the angle on the horizontal plane (longitude), measured from the positive part of the x axis. angle must be a number between 0 and 360 that sets the initial value of theta at which the surface will start. A value bigger than 0 will eliminate a part of the sphere’s surface.
See also
endthetaandthetaresolution.Categories: Package dynamics · Plotting ·
- Object option: surface [surface] 
-
The surfaces of the object will be rendered and the lines and points of the triangulation used to build the surface will not be shown. This is the default behavior, which can be changed using either the option
pointsorwireframe.Categories: Package dynamics · Plotting ·
- Object option: thetaresolution [thetaresolution, num] 
Default value:
The number of sub-intervals into which the theta angle interval from
startthetatoendthetawill be divided. num must be a positive integer.See also
startthetaandendtheta.Categories: Package dynamics · Plotting ·
- Object option: track [track, positions] 
-
positions should be a list of points. When the play button is pressed, the object position will be changed sequentially through all the points in the list, at intervals of time given by the option
tstep, leaving behind a track of the object’s trajectory. The rewind button can be used to point at the start of the sequence making the animation restart after the play button is pressed again.Example. This will show the trajectory of a ball thrown with speed of 5 m/s, at an angle of 45 degrees, when the air resistance can be neglected:
(%i1) p: makelist ([0,4*t,4*t- 9.8*t^2/2], t, 0, 0.82, 0.01)$

(%i2) ball: [sphere, [radius,0.1], [color,red], [track,p]]$

(%i3) ground: [cube, [xlength,2], [ylength,4], [zlength,0.2],
      [position,0,1.5,-0.2],[color,green]]$

(%i4) scene (ball, ground)$
See also
animation.Categories: Package dynamics · Plotting ·
- Object option: xlength [xlength, length] 
Default value:
1The height of a cube in the x direction. length must be a positive number. See also
ylengthandzlength.Categories: Package dynamics · Plotting ·
- Object option: ylength [ylength, length] 
Default value:
1The height of a cube in the y direction. length must be a positive number. See also
xlengthandzlength.Categories: Package dynamics · Plotting ·
- Object option: zlength [zlength, length] 
Default value:
1The height of a cube in z the direction. length must be a positive number. See also
xlengthandylength.Categories: Package dynamics · Plotting ·
- Object option: wireframe [wireframe] 
-
Only the edges of the triangulation used to render the surface will be shown. Example:
[cube, [wireframe]]Categories: Package dynamics · Plotting ·