ADW-Charting: simple charts in Common Lisp

Table of Contents

1 Introduction

ADW-Charting is a simple chart drawing library for quickly creating reasonable-looking charts. It presents a function-oriented interface similar to Vecto, and saves results to PNG. Since ADW-Charting and all supporting libraries are written completely in Common Lisp, without depending on external non-Lisp libraries, it should work in any Common Lisp environment. ADW-Charting is available under a BSD-like license. The 'ADW' in the name is referencing my employer, Acceleration.net, who has sponsored much of this work. The current version is 0.8, released on August 25th, 2009.

The canonical location for ADW-Charting is http://common-lisp.net/project/adw-charting/

Download shortcut: http://common-lisp.net/project/adw-charting/adw-charting.tar.gz

2 Installation

ADW-Charting is not yet asdf-installable, but that is on the todo list. For now, download the tarball at http://common-lisp.net/project/adw-charting/adw-charting.tar.gz or go straight to the darcs repository located at http://common-lisp.net/project/adw-charting/darcs/adw-charting

3 Rendering Backends

ADW-Charting has two rendering backends, one using Vecto to create PNG files directly, another using the Google Chart API to let Google handle the drawing duties. Each has it's pros and cons, and is activated by loading a different .asd file. You can use both at the same time. They are both actively developed (albeit at a snail's pace).

3.1 Vecto backend, adw-charting-vecto.asd

Pros:

  • pure lisp solution, total control is available
  • size and data density are only limited by computing resources

Cons:

  • conses an awful lot
  • generated PNGs don't display in Microsoft image viewer, must be viewed via a browser (IE shows them fine)

3.2 Google backend, adw-charting-google.asd

With this renderer, adw-charting assembles the url parameters and makes HTTP calls (using Drakma) to Google's chart service, or can give you the url directly.

Pros:

  • much less CPU intensive
  • images are served using Google's bandwidth, not yours
  • simple charts frequently look better
  • more chart features are available, although many aren't yet implemented in the vecto backend

Cons:

  • limited to 300,000 pixels per image (which is smaller than you think)
  • Google's label placement can be screwy sometimes
  • requires the lisp be connected to the internet
  • depends on a third party service that might be shut off tomorrow
  • any sensitive information would travel to another server via http
  • can't graph large datasets (all data has to be passed on the querystring)

3.3 Which one should you use?

The answer is always "it depends". I generally use the google backend for public data, or if I want to use a chart feature that is not implemented in the Vecto backend. I use vecto backend for private data, when I want a very large chart, or when I want to work disconnected.

Eventually, I would like to improve the performance and functionality of the vecto backend to the point that the google backend is redundant.

4 Sample Usage

Here are a very basic examples. More can be found in the gallery.

4.1 loading adw-charting into your lisp

To use the Vecto backend:

(asdf:oos 'asdf:load-op 'adw-charting-vecto)

To use the Google backend:

(asdf:oos 'asdf:load-op 'adw-charting-google)

You can use both at once if you want to mix-and-match backends.

4.2 minimal pie chart

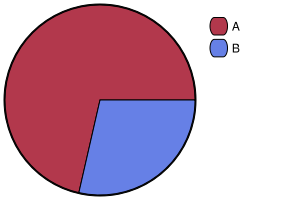
A simple pie chart using Vecto to generate the PNG file:

4.2.1 vecto backend

(with-chart (:pie 300 200)
  (add-slice "A" 5.0d0)
  (add-slice "B" 2.0d0)
  (save-file "minimal-pie-chart-vecto.png"))

minimal-pie-chart-vecto.png

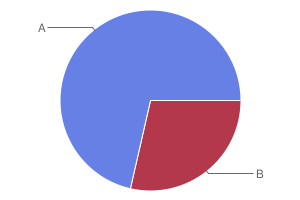
4.2.2 google backend

The same pie chart using the Google Chart API to generate the PNG:

(with-gchart (:pie 300 200)
  (add-slice "A" 5.0d0)
  (add-slice "B" 2.0d0)
  (add-features :label)
  (save-file "minimal-pie-chart-google.png"))

minimal-pie-chart-google.png

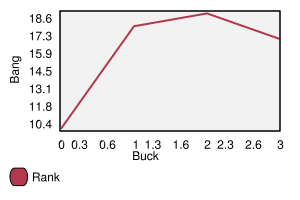
4.3 minimal line chart

4.3.1 vecto backend

(with-chart (:line 300 200)
  (add-series "Rank" '((0 10) (1 18) (2 19) (3 17)))
  (set-axis :y "Bang")
  (set-axis :x "Buck")
  (save-file "minimal-line-chart-vecto.png"))

minimal-line-chart-vecto.png

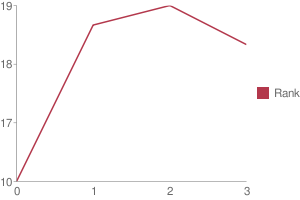
4.3.2 google backend

(with-gchart (:line 300 200)
  (add-series "Rank" '((0 10) (1 18) (2 19) (3 17)))
  (set-axis :y "Bang")
  (set-axis :x "Buck")
  (add-feature :label)
  (save-file "minimal-line-chart-google.png"))

minimal-line-chart-google.png

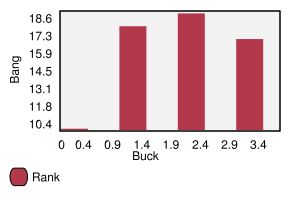
4.4 minimal bar chart

4.4.1 vecto backend

(with-chart (:bar 300 200)
  (add-series "Rank" '((0 10) (1 18) (2 19) (3 17)))
  (set-axis :y "Bang")
  (set-axis :x "Buck")
  (save-file "minimal-bar-chart-vecto.png"))

minimal-bar-chart-vecto.png

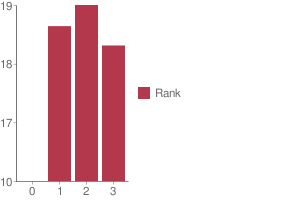
4.4.2 google backend

(with-gchart (:v-bar 300 200)
  (add-series "Rank" '((0 10) (1 18) (2 19) (3 17)))
  (set-axis :y "Bang")
  (set-axis :x "Buck")
  (add-feature :label)
  (save-file "minimal-bar-chart-google.png"))

minimal-bar-chart-google.png

4.5 star ratings

This is a vecto-only chart:

(with-chart (:star-rating 300 60)
  (set-rating 4.5)
  (save-file "star-rating.png"))

star-rating.png

Be sure the width is at least 5 times the height.

5 Caveats / Gotchas

6 Known Bugs

6.1 bar charts with many series (lots of bars) can run over the right edge of the graph

6.2

7 Feedback

If you have any questions, comments, bug reports, or other feedback regarding ADW-Charting, please email me.

Progress and previews are occasionally available on my blog: http://ryepup.unwashedmeme.com/blog/category/adw-charting/

8 API reference

adw-charting is split into 3 .asd files:

These all export functions into the adw-charting package.

In most cases, to render a chart you call some with-* variant to create a chart context, call functions in that context to configure the chart, then call a save-* function to perform the rendering. Most functions will not work if they called outside a chart context, with a few exceptions.

If something below is marked as experimental, that means it probably doesn't work.

Many functions unintentionally return values. Only intentional return values are listed below.

8.1 Creating a chart

8.1.1 with-chart

(defmacro with-chart ((type width height &key (background '(1 1 1))) &body body))

Initializes a vecto chart.

  • type determines how the chart is rendered. Must be one of:
    • :line - normal line chart
    • :bar - normal bar chart
    • :pie - normal pie chart
    • :star-rating - displays a percentage as partially filled stars. See the star rating example. Be sure the width is at least 5 times the height for this chart type.
  • width image width in pixels
  • height image height in pixels
  • background is an optional background color for the chart, defaulting to white.

8.1.2 with-gchart

(defmacro with-gchart ((type width height &key (background '(1 1 1))) &body body))

Initializes a google chart.

  • type determines how the chart is rendered. Must be one of:
    • :pie - normal pie chart
    • :pie-3d - 3d pie chart
    • :line - normal line chart
    • :v-bar - bar chart with bars rising vertically (stacked)
    • :h-bar - bar chart with bars rising horizontally
    • :v-gbar - ?
    • :h-gbar - ?
  • width image width in pixels
  • height image height in pixels
  • background is an optional background color for the chart, defaulting to white.

8.1.3 google-o-meter

(defun google-o-meter (percentage width &key label colors show-percentage)) => url

The meter is very different from other charts types, so has it's own little function. Image height is calculated from the width.

It currently only returns the URL needed to fetch the chart from google, and creating a PNG from that is not part of this library.

  • percentage returns the URL to request to get the google-o-meter chart
  • width image width in pixels
  • label a title to have on the meter
  • colors a list of colors used to make the gradient on the meter
  • show-percentage when non-nil, print the percentage on the meter

8.1.4 deprecated

  • with-pie-chart: use (with-chart (:pie ...
  • with-line-chart: use (with-chart (:line ...
  • with-bar-chart: use (with-chart (:bar ...

8.2 Modifying a chart

8.2.1 pie charts

  • add-slice
    (defun add-slice (label value &key color))
    

    Adds a slice to the pie.

    • label a string to identify this slice
    • value any number
    • color a color for this slice, see colors. A unique color will be automatically assigned.

8.2.2 bar and line charts

  • add-series
    (defun add-series (label data &key color (mode 'default)))
    
    • label a string to identify this series
    • data a list of (x y) pairs
    • color a color for this series, see colors. A unique color will be automatically assigned.
    • mode experimental use :line on bar charts to render this series as a line instead of a bar.
  • set-axis
    (defun set-axis (axis title &key draw-gridlines-p
                     (label-formatter #'default-label-formatter)
                     (mode :value)
                     data-interval
                     scalefn
                     draw-zero-p
                     angle))
    
    • axis which axis you'd like to configur, must be :x or :y
    • title a string used to label the axis. nil for no axis label
    • draw-gridlines-p when non-nil, draws fairly ugly lines that match with the axis labels
    • label-formatter determines how values from your data is converted to axis labels. You can pass this:
      1. a function of 1 argument
      2. a string to be used as the control string to a format call

      The default tries to format values in usually acceptable way.

    • draw-zero-p if non-nil, force this axis to show 0, even if it is notcontained within the data.
    • data-interval a number that should be used as the interval whendrawing axis labels. If nil, a suitable interval will be chosenautomatically.
    • mode experimental determines how the axis values are calculated, intended be used to specify non-ordered axis values in the future.
    • scalefn experimental a function used to scale data on this axis before rendering. Currently only respected by the google backend, and I'm not sure why.
    • angle experimental used to rotate axis label text

8.2.3 vecto star-rating charts

  • set-rating
    (defun set-rating (rating))
    

    Determines how much of the stars are filled in.

    • rating the number of stars to fill, as a number, with a max of 5.
  • set-color
    (defun set-color (color))
    

    Determines star color.

    • color a color for the stars, see colors.

8.2.4 google charts

  • add-feature
    (defgeneric add-feature (feature-name))
    

    Google charts have many options that can be turned on, and these are modeled as features

    • feature-name a keyword indicating what google option to enable.
      feature-name must be one of:
      1. :label adds slice/series labels
      2. :transparent-background renders the png with a transparent background
      3. :adjusted-zero adjust the zero line of the chart to match your data. See bar chart zero line.
      4. :data-scaling calculate graph bounds based on your data. See data scaling.
      5. :label-percentages add percentages after labels on pie charts (automatically adds the :label feature)
  • add-features
    (defun add-features (&rest names))
    

    Calls add-feature for each item in names.

  • add-title
    (defmethod add-title (title))
    

    Sets the chart title.

    • title string to be used for the title of the chart

8.3 Saving the chart

These methods are implemented for google and vecto backends. All output is in PNG format.

8.3.1 save-file

(defun save-file (filename)) => truename

Returns the truename of the newly written file.

  • filename the path to save as, will automatically overwrite

8.3.2 save-stream

(defun save-stream (stream))
  • stream the stream to write PNG output to

8.4 Google misc functions

8.4.1 make-color

(defun make-color (html-color)) => color

Converts a string into a color.

  • html-color a hex string like an html color (eg: "aa4422")

8.4.2 chart-url

(defun chart-url ()) => url

Calculates the URL needed to generate the google chart, returns it as a string.

9 Acknowledgements

Author: Ryan Davis <ryan@acceleration.net>

Date: 2009-08-25 13:30:00

HTML generated by org-mode 6.21b in emacs 23